Let’s talk a little bit about the cosmic importance of the number 1312.50 on the ES front month futures contract. This level, what we call a tri-star level, has been a magnet point for the market many times in the last 13 (yes, 13) years.
We consider tri-star levels to be key points that the market has touched many times from above and below. Typically, once the market approaches a tri-star level, it is drawn to it like a magnet. The 1312.50 is one of the most used of the tri-star levels. Let’s have a look.
Here is a monthly chart of the ES front month futures contract going back to the late 1990’s:
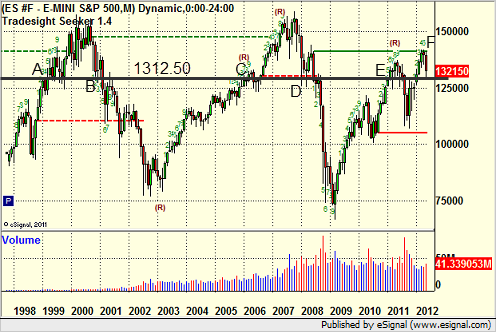
Those of us that have been trading a while remember the level dominated the market throughout much of 1999. The level was first hit in January of that year (point A on the chart above), and it was touched in 8 of the 12 months of that year, but even more interesting was how often the level was used intraday throughout the year. The market accelerated up in late 1999 for the Y2K run-up, then came back to the 1312.50 level on the way down during the liquidity unwind that occurred after, hitting the level again late in 2000 (point B) and then using it from both sides over the next six months. We wouldn’t see the level again until 2006 at point C, but then again, we played around that area for months. In 2008, on the way back down, 1312.50 was support twice (D) and then used for several months again.
In the process of QE1 and QE2 and the economic recovery that has been occurring slowly since 2009, the market made its way back to the level in early 2011 at point E. The number came up over and over in our trading throughout 2011. The market then reached up to a key “Static Trendline” on the monthly chart (the green line at F), found resistance there, and then made it’s way back to 1312.50 this last month.
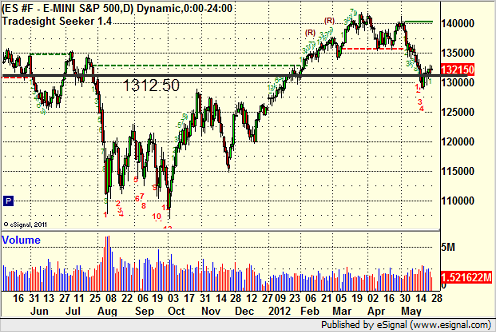
Zooming into a daily chart of the last year, you can get a better feel for how momentum swings the market around this level like a magnet each time it comes into range:
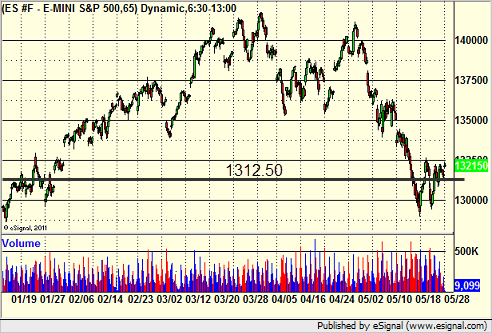
That view gets even more interesting when you scale down to a 65-minute chart (6 equal bars per day), as you can clearly see that each time the market reaches this area, it plays around it for a few days:
Now, let’s zoom in one final time to a 5-minute chart, which will give us the most clarity about the importance of this level. After the market rallied up and hit the Static Trendline on the monthly chart that I showed above, we had reached as high as 1360. In the middle of May, the market headed sharply lower, dropping over 40 points in five days, ending with a bounce off of the 1312.50 level on May 17 at point A on this chart:
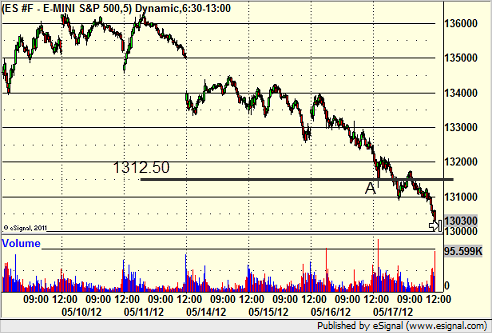
So in a decline in the market of over 40 points in a handful of days, the market was drawn straight to 1312.50, and then got a small bounce before recoiling and breaking under that level. What have we seen in the 7 days since then? Have a look:
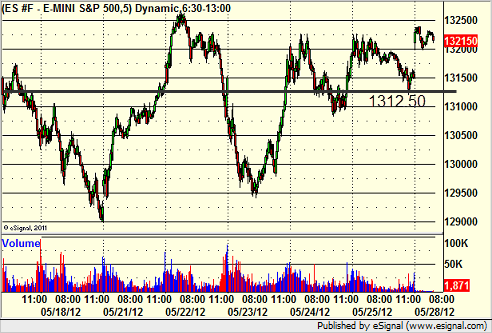
Just about every single day (except May 18) has touched the level. In fact, it’s basically the mid-point of this period, and the swings around it have gotten smaller and smaller as the market sticks even more to the tri-star level. In fact, in the last hour of Friday’s light-volume action heading into this Memorial Day weekend, the market looked like it might even close right at that level. There would have been some irony in closing at the number that the market has remembered most over the last 13 years for Memorial Day.
Be aware of these key tri-star levels (there are others) as a lot can be learned from monitoring the market behavior around them.
The Magic Number on the ES: 1312.50
May 28, 2012
|In Tradesight