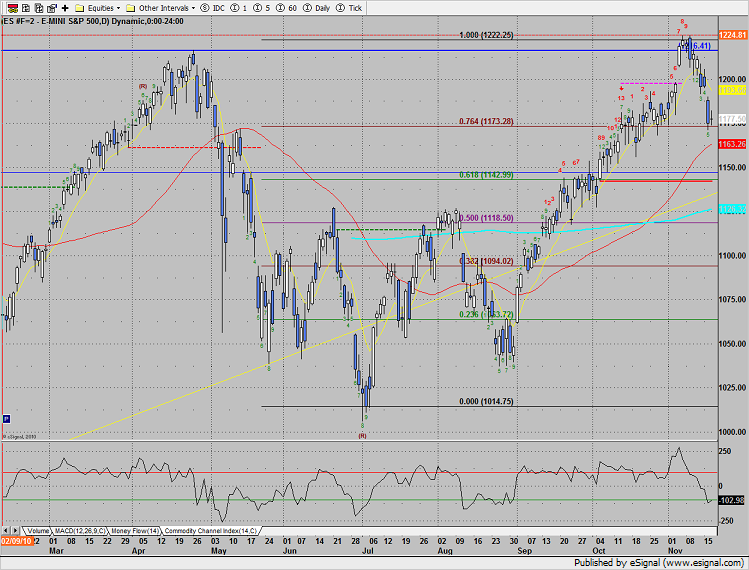
The SP resolved the inside pattern with a vicious down day. Price declined to the first fib. This is a logical resting point for traders to measure the impulse. Note that the CCI is solidly negative but not terminally oversold. The next area of support will be the rising 50dma (red) at about 1162.
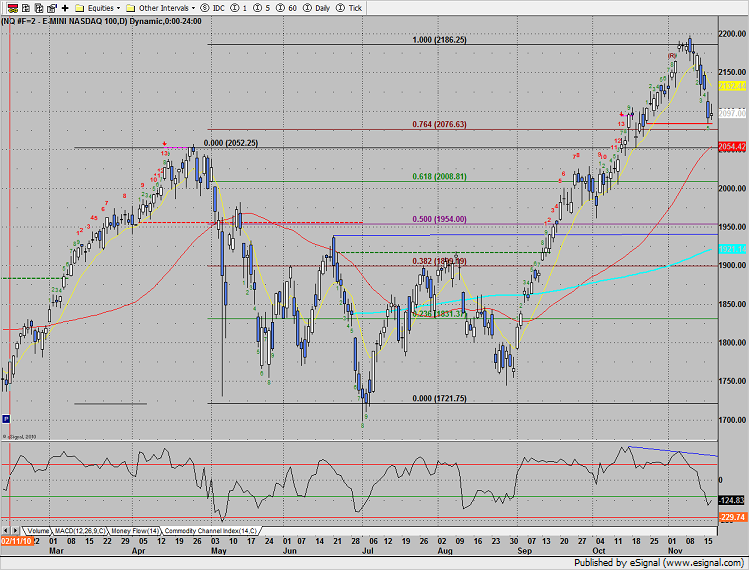
Naz broke out of the inside pattern and hit the area of support. The static trend line (red) is the first area of support. The 76% fib will be some support and then the April highs will be the focus area.
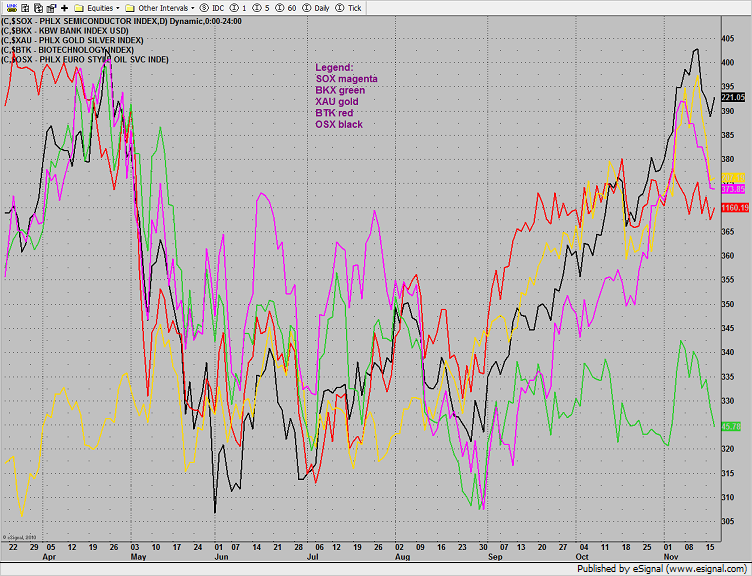
Multi sector daily chart:
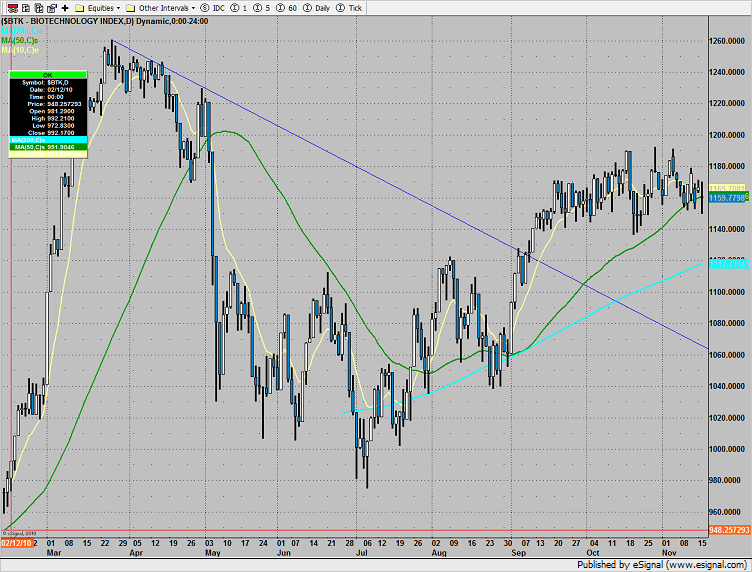
The BTK is still in the same confounding sideways range:
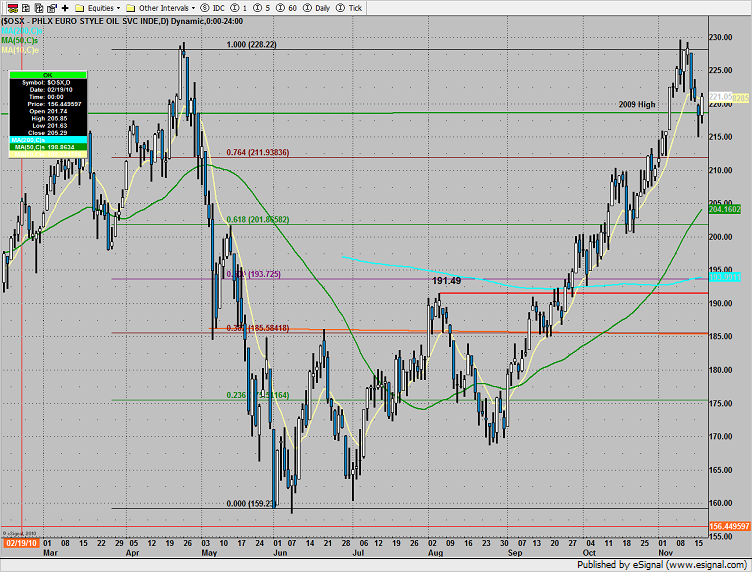
The OSX was down less than the broad market which is encouraging to the bulls. Price settled above the midpoint of the range.
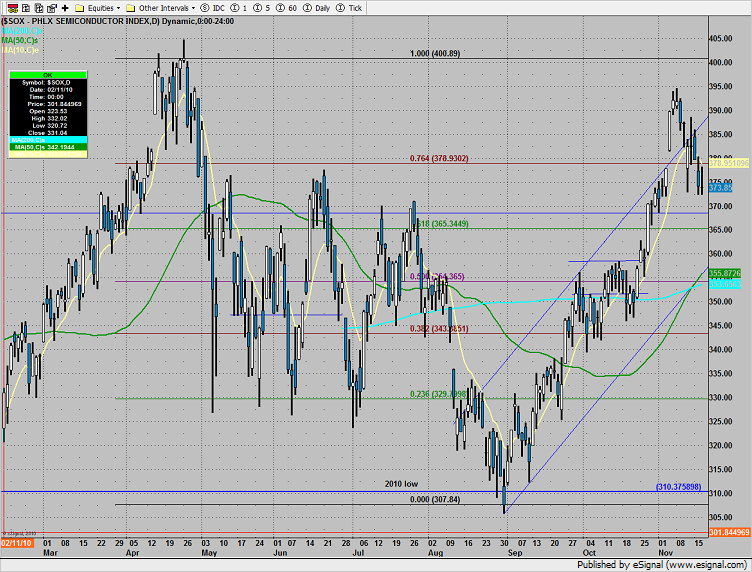
The SOX lost 5.50and has settled back in the prior range.
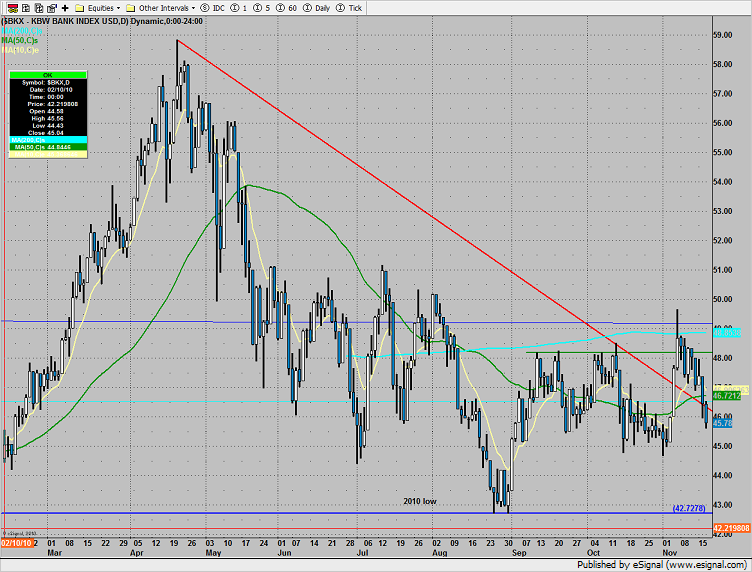
The BKX was lower by 2%. Price settled below both the 50 and 200dmas.
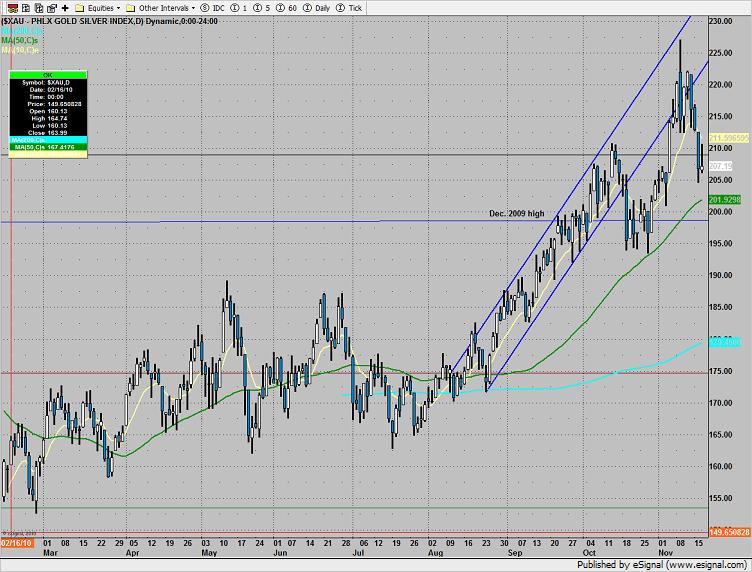
The XAU was the laggard. The 50dma at 2015.0 is the next area of support. Keep in mind that after a 3 day drop there is usually some order of bounce.
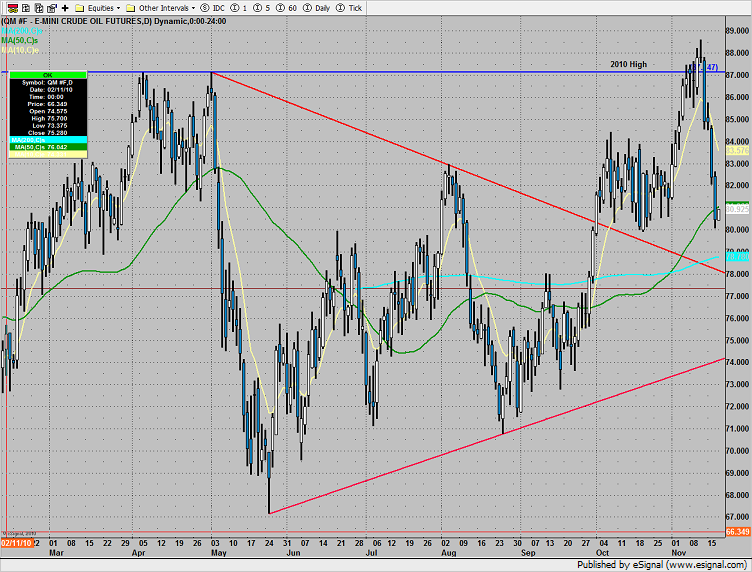
Oil has declined to support at the 82 area. Note the static trend line just below.
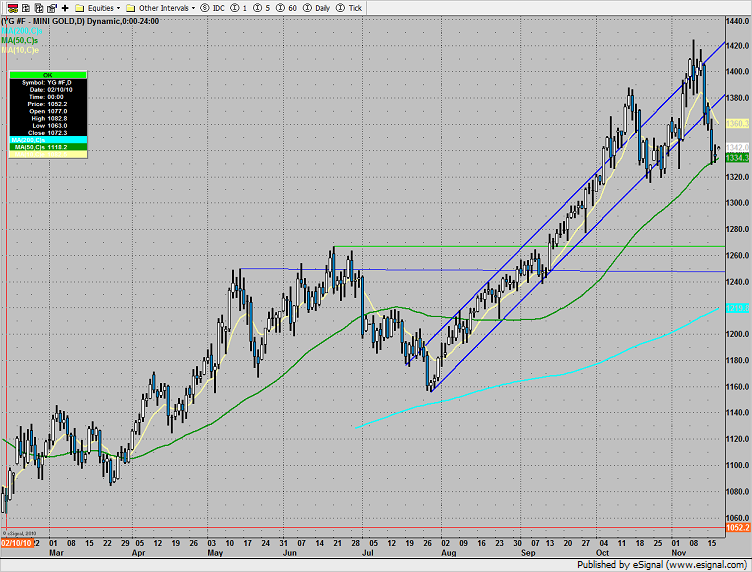
Gold has declined to support at 1320. A loss of the 1315 area puts much lower prices in play and will confirm that the intermediate trend is negative.
Stock Market Index Preview for 11/17/10
November 17, 2010
|In Tradesight