All charts for all asset classes in our reports have been shifted to eSignal 11 screenshots effective today. There is a slightly different (but cleaner) look to these charts. They also show as EST.
Not much market volume again. Took an ES short on a Comber sell signal that didn’t work, but we will discuss below. Volume was horrible again.
Net ticks: ticks.
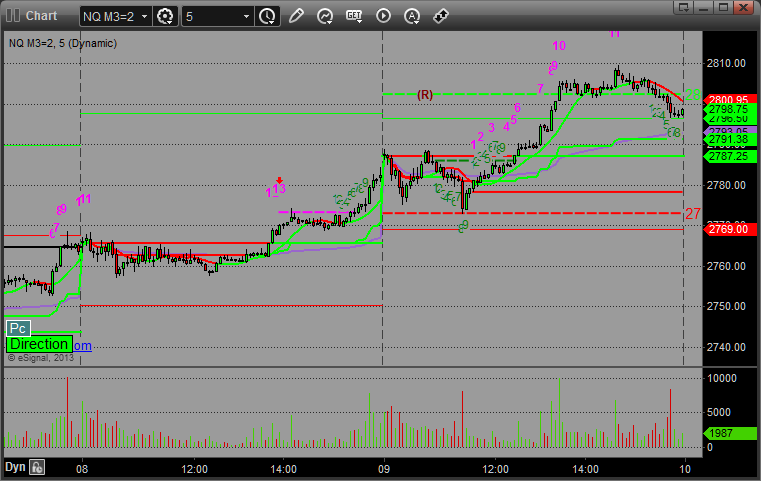
As usual, let’s start by taking a look at the ES and NQ with our market directional lines, VWAP, and Comber on the 5-minute chart from today’s session:
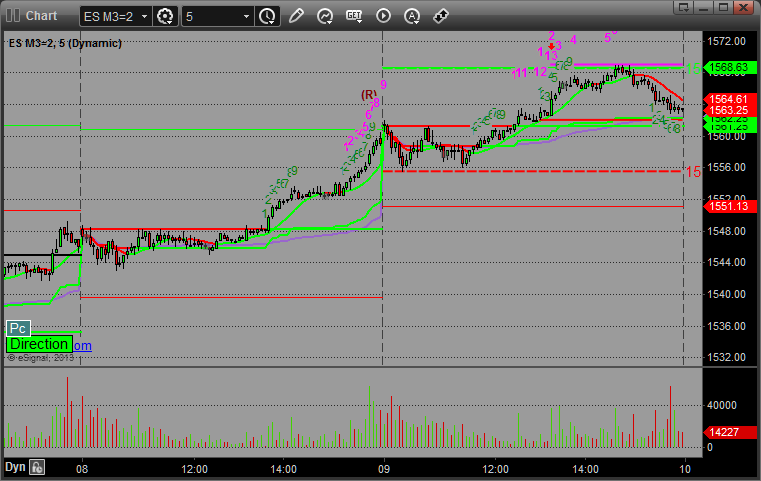
ES:
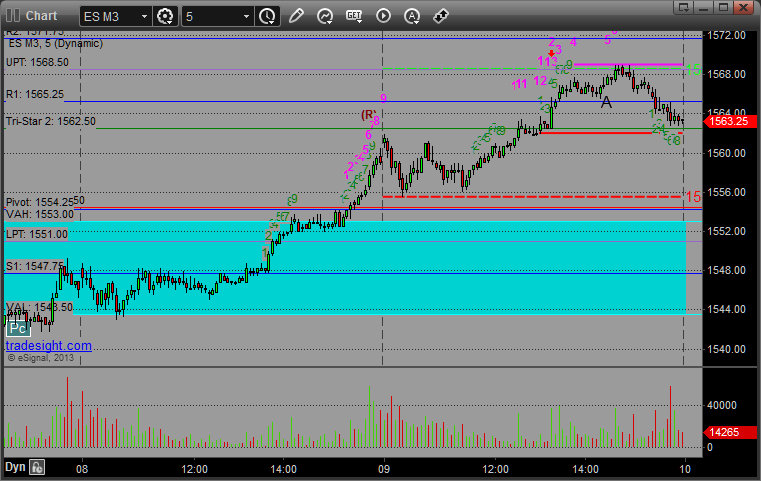
Note that when we make calls in the Messenger, we try to keep them to calls based on the Levels with 6 ticks of risk (plus one for the spread). We don’t typically make calls based on the Comber and Seeker signals because they often require a bit more finesse when it comes to the entry point (not usually a “fixed” number) and a stop (should go over the “risk” level). In this case, since volume was so bad and there wasn’t anything else to call, I made a call looking to roll over after the Comber 13 sell signal. It was a short at 1565.50. That triggered at A and stopped out for the 7 ticks, but as you can see on the chart, it used the risk line perfectly and never stopped out if you used that, which is really the stop you should use on any Comber/Seeker call:
Futures Calls Recap for 4/9/13
April 9, 2013
|In Tradesight