I get asked all of the time what the secret is to making money trading. The answer is simple, though not something people typically want to hear. If I had to pick one thing to teach new traders, I would say this: “Markets ebb and flow, but you need range, volume, and volatility to make money. The secret to success is that you have to stick around for those periods.”
When it comes to Stocks and Futures, success comes from volume in the markets, which typically leads to better volatility and ranges. Since these markets do measure volume, it becomes a fairly straight-forward process to analyze what is happening. This is why we analyze volume after 30 and 60 minutes each day…it tells you so much about your chances for success for the rest of the session.
Now, another way to view this from an “end of day” perspective is to look at NASDAQ volume daily. We like to see volume over 2 billion shares per day on the NASDAQ. Those are typically the “good” trading days. If you go back to the start of the year and view our “2010 Summary,” you’ll see that most of the last year so volume over 2 billion NASDAQ shares. However, this year, we’ve been hit or miss in that arena.
Here’s NASDAQ volume daily, and I’ve put a box around anything UNDER 2 billion shares since January, and you’ll notice that most of the days fall into that category:
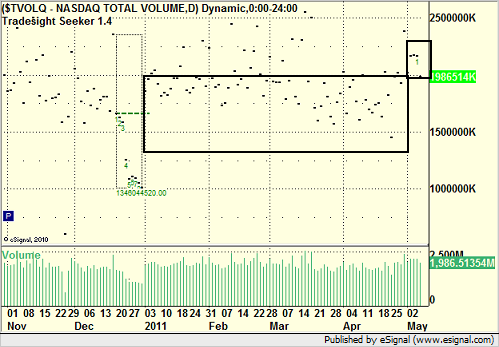
So, even though we have had days well over 2 billion shares, they aren’t the norm, and this is a complete departure from what we are used to seeing. Having said that, markets aren’t always what we want or need them to be, and you have to trade what you get. The last month in particular was weak until this last week. As the chart above shows, the last week was the first week in a while that was consistently over 2 billion shares of daily volume, and we had some extremely easy trading, from futures to stocks to ETF calls. Lots of nice winners on those days.
Why is the volume back? Well, in prior weeks, we had concerns about the economy, the debt ceiling, unemployment, the US Dollar, the Fed, and quarterly earnings. With several of those items passed us this last week and gold and oil tanking, the markets picked up their volume (even though much of it was to the downside, which is fine for us as traders).
So let’s see what that means to range and volatility.
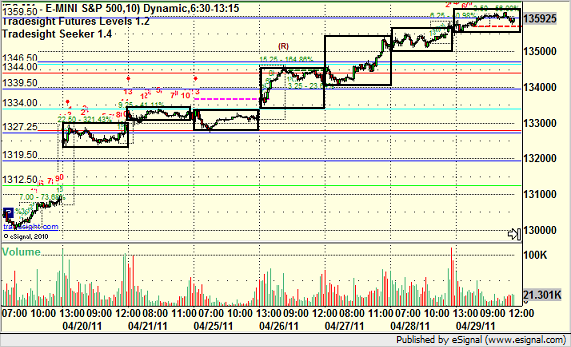
Here’s the intraday 10-minute bar data on the ES in the days PRIOR to this last week. I’ve drawn boxes around the ranges for each day because it makes it easier to see. Without volume, things were pretty flat overall, even if the market trended for several days:
Meanwhile, look at this week. With volume back, ranges were big, there was back and forth movement, and we did well:
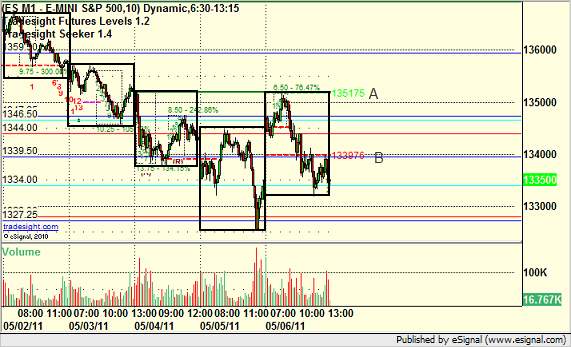
Look at the last day on that chart, for example, and note that the move from the green dashed line at A to the red dashed line at B was AVERAGE DAILY RANGE, and then we exceeded that to the downside by a lot. In other words, with volume, we’re trading more than the averages.
This is very important to recognize and understand when putting together an annual trading system.
The Importance of Ranges and Volatility in Stocks and Futures
May 8, 2011
|In Tradesight