Let’s have an educational discussion about the importance of lining up key tools where we can measure turning points in the market from energy construction and really apply them when the market hits a major support or resistance point. We view the start of the Forex session as 5 pm EST, which is 14:00 on these charts on Pacific Time. Here is the first several hours of the NZDUSD action Thursday evening from the start of the session through the first few hours of the European session:
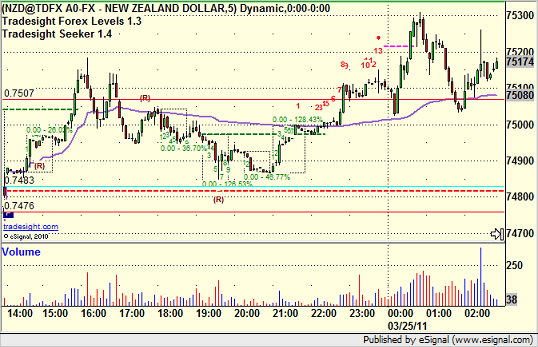
Clearly, the activity picks up with the European session start. We like to see volume and activity for the purposes of spotting trade setups. One of key tools, the Seeker, measures market energy by using a specific bar counting mechanism. After we get 9 bars that meet the counting criteria in one direction, we then look for the counting mechanism to terminate. When that happens, the tool draws a dashed box around that area of the chart. This represents a potential exhaustion point in the market. So let’s see how this plays out now that activity has picked up for a few hours with the European session:
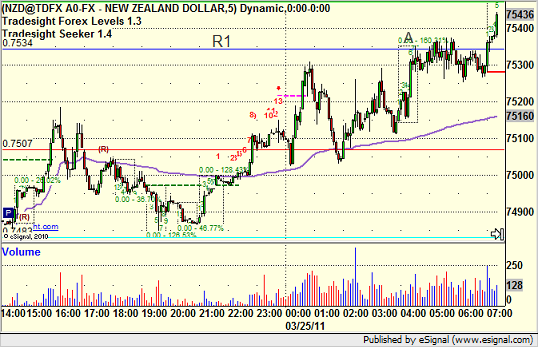
At this point, we’ve already had one box completion where the NZDUSD met our count criteria and ran in to R1 from the Pivot series (blue line). You can use this as a short entry in the market, and for several hours, the market doesn’t head higher, so the energy was exhausted. Then, the market starts to head up again and we get another 9 bar count that leads to the completion of another Seeker box. This time, it is lines up against the dashed green line. What is that green line? That is the Average Daily Range high boundary for the NZDUSD. What that means is that the NZDUSD currently has traded an average of 93 pips per session over the last six months. At that green line, the distance from the low of the session (back near the start at 5 pm EST in this case) to the green line is 93 pips:
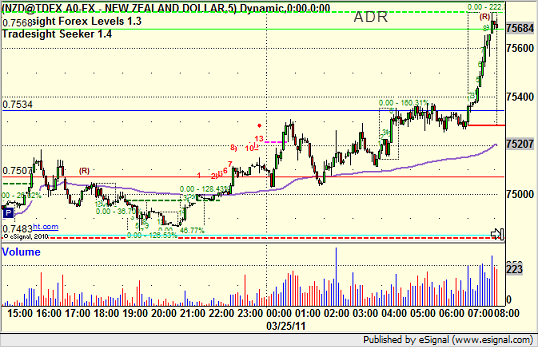
It often matters by itself, but in this case, we’re also hitting that key area that means that the market has covered the range that it covers on average at the same time that the Seeker tool is getting an exhaustion signal. Again, that gives us a short entry with a stop a little bit over the highs. And how does this work? Let’s see the rest of the session:
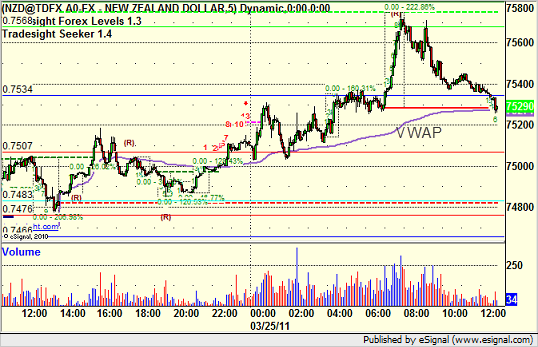
A 50-pip move back to the VWAP. The combination of the Average Daily Range line with our Seeker signal gave us two trades. One stopped for a small loss, and the other worked for 50 pips.
If you haven’t yet taken a 2-week trial to our services, you can do so here for only $2.97. This includes our Trading Lab with 5 analysts that trade every day for a living, so you can get top-notch guidance, trade calls, and ask questions regarding trades in all asset classes.
NZDUSD Signal with the Seeker and ADR
March 25, 2011
|In Tradesight