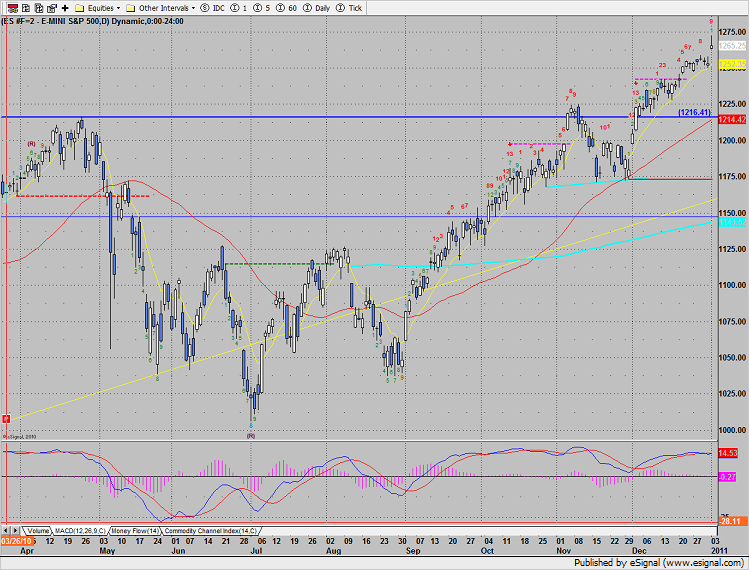
The SP added 12 handles on the day and most of the advance was from the overnight gap. Price settled in the lower half of the traded range which leaves an awkward candle on the chart. Price action could be flakey for a couple of days until either the gap proves itself or fills.
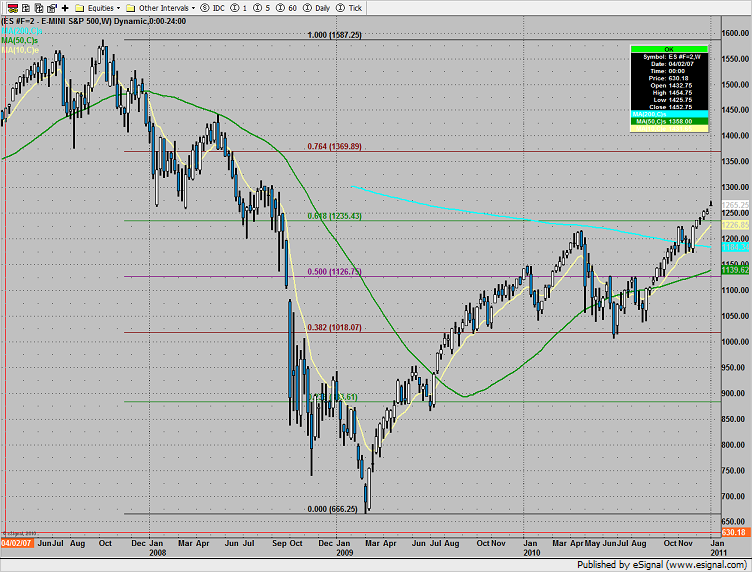
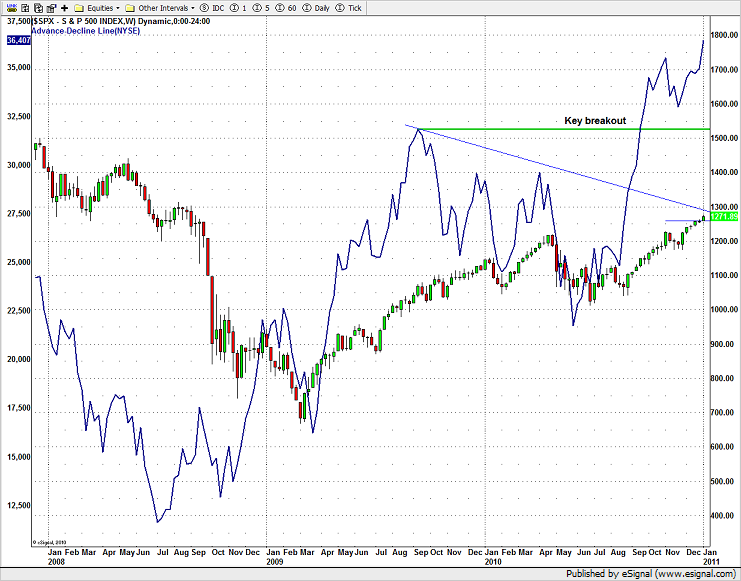
For some added perspective below is the long term weekly chart of the SP futures. Fibs have been applied from the 2008 high to the 2009 swing low.
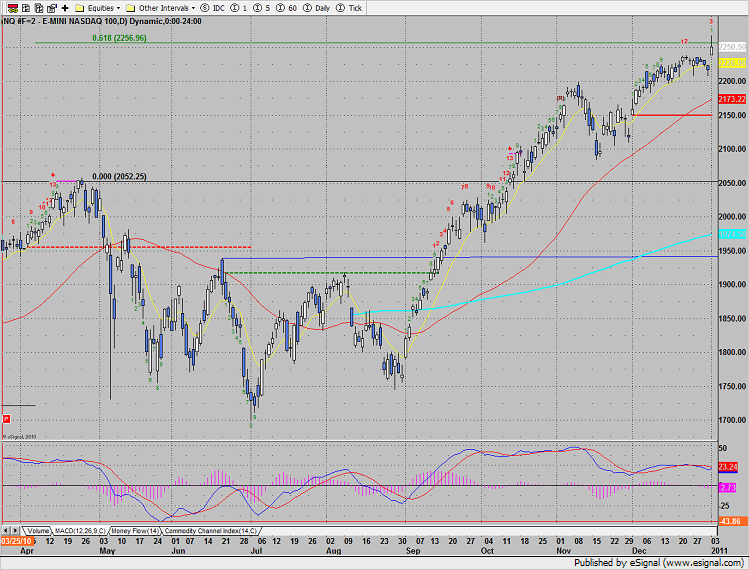
Naz was higher by 34 and used the prior high for intraday support. Set an alarm for a break under 2238 which gets price into the gap.
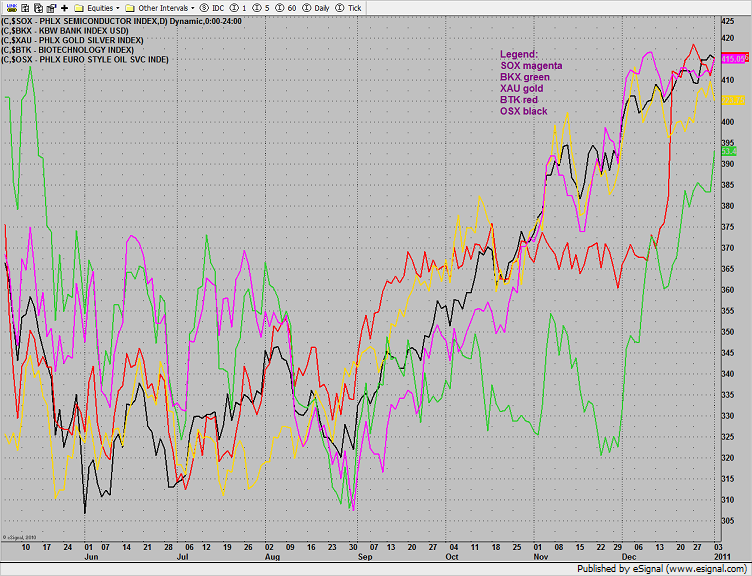
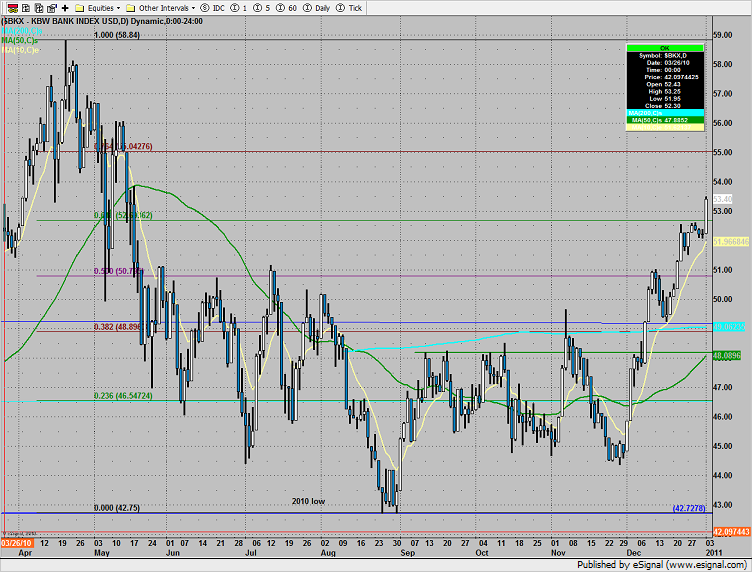
The multi sector daily chart shows the banks are coming on strong:
The NYSE cumulative A/D line has broken out to a new high which is the positive equity correlation that bulls need to see. There is no divergence at this time.
The BKX was top gun breaking through the 62% fib. 55 is the next trade-to-target.
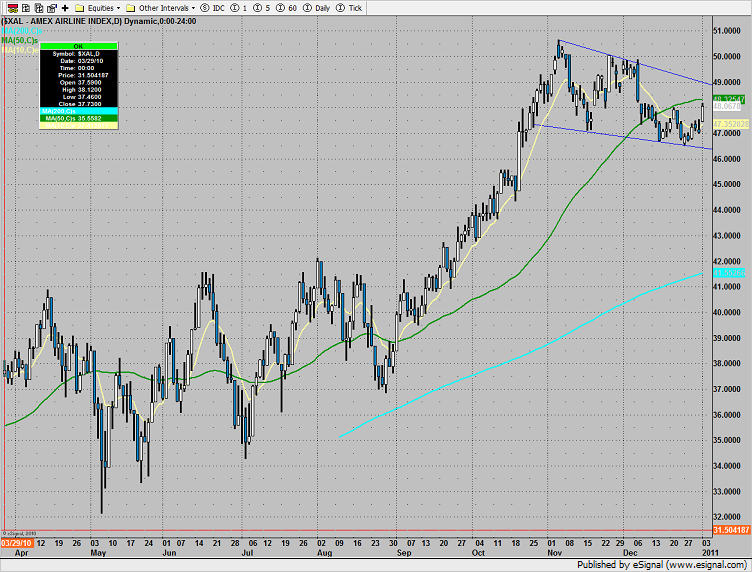
The airlines are at the midpoint of a falling wedge consolidation pattern. Set an alarm for a break over 49 in the XAL.
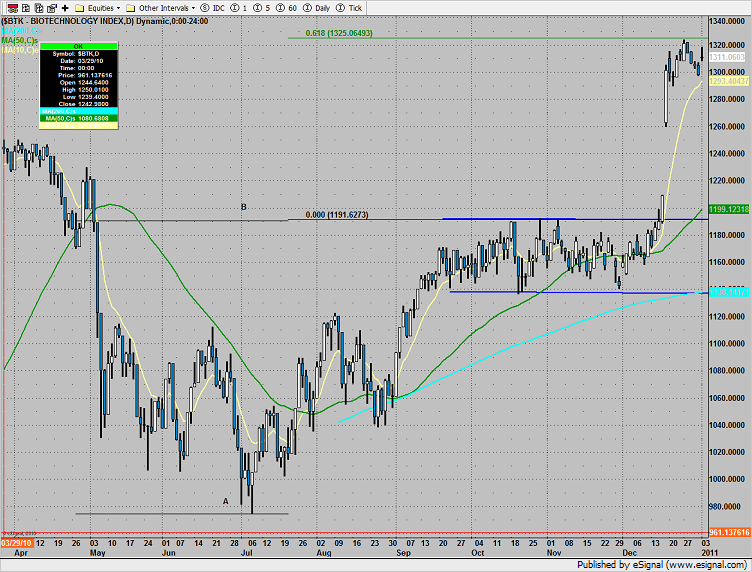
The biotechs are still trapped between the 10ema and the measured move resistance.
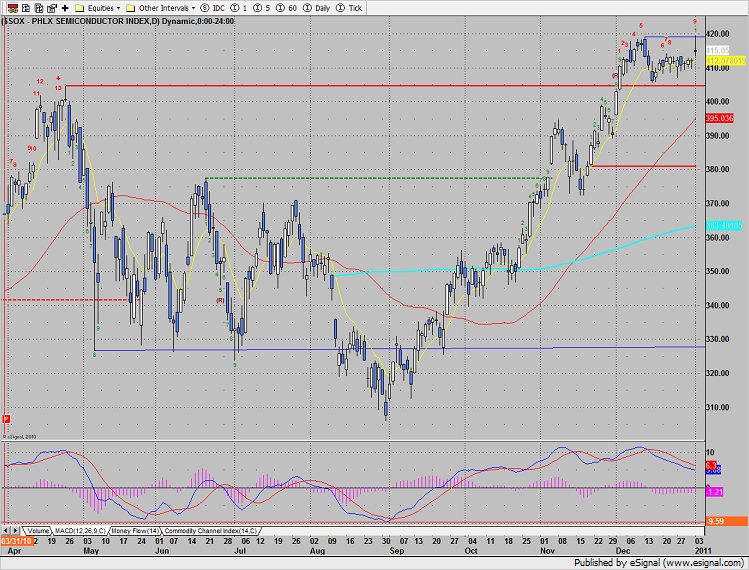
The SOX tested but couldn’t break through the key 420 level. A break back under 405 could be a notable rejection of the new high. The MACD looks sloppy.
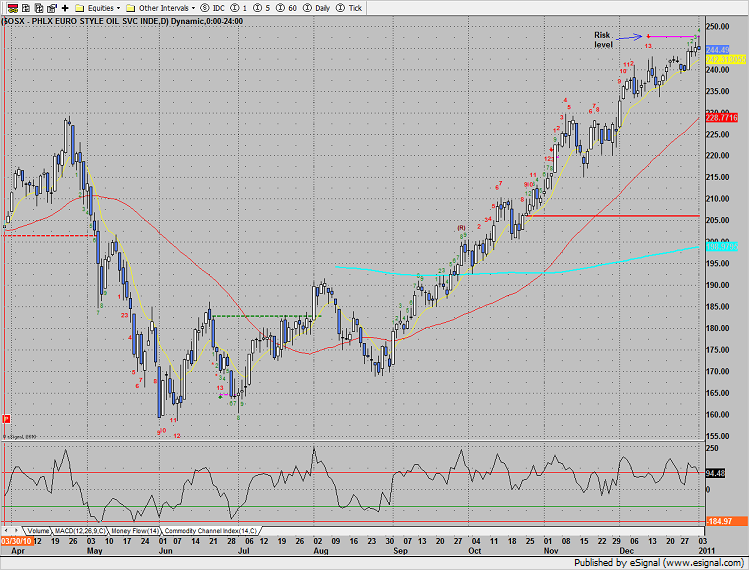
The OSX was lower on the day, notably underperforming the broad market. The Seeker exhaustion signal remains active until the risk level is broken.
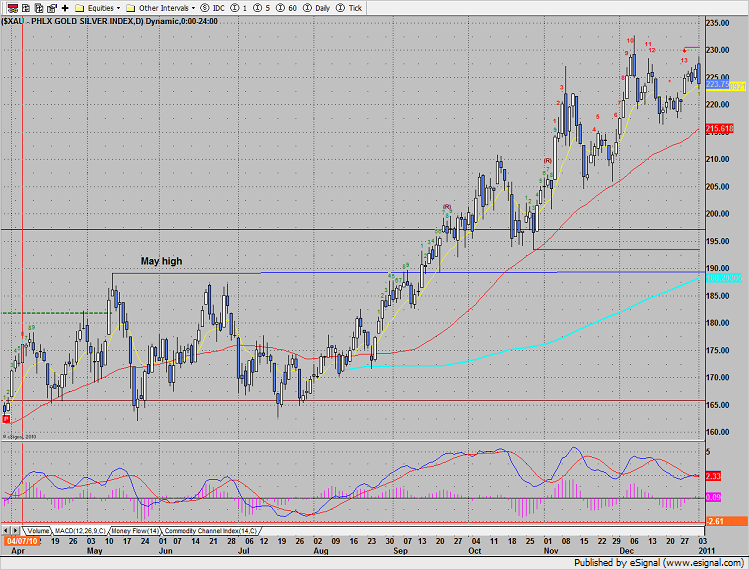
The XAU was the worst performing sector of the day. Monday’s price action left an outside day down candle on the chart. The Seeker exhaustion signal is still active.
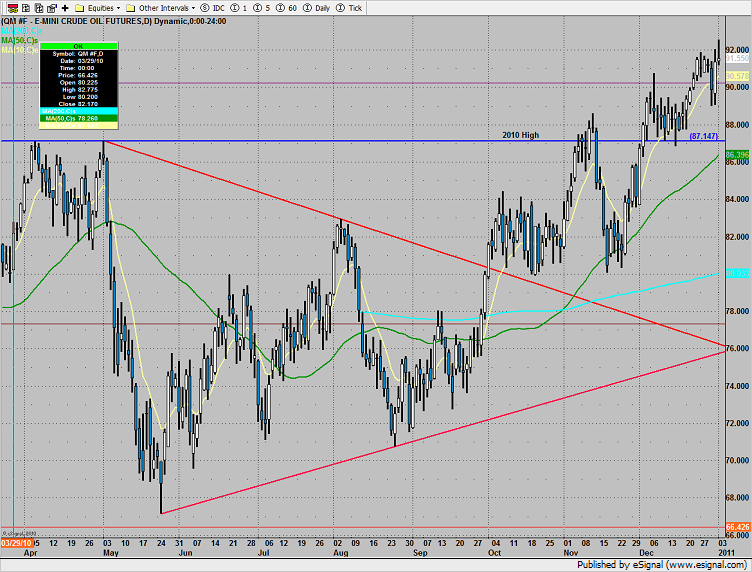
Oil still near range high on the chart:
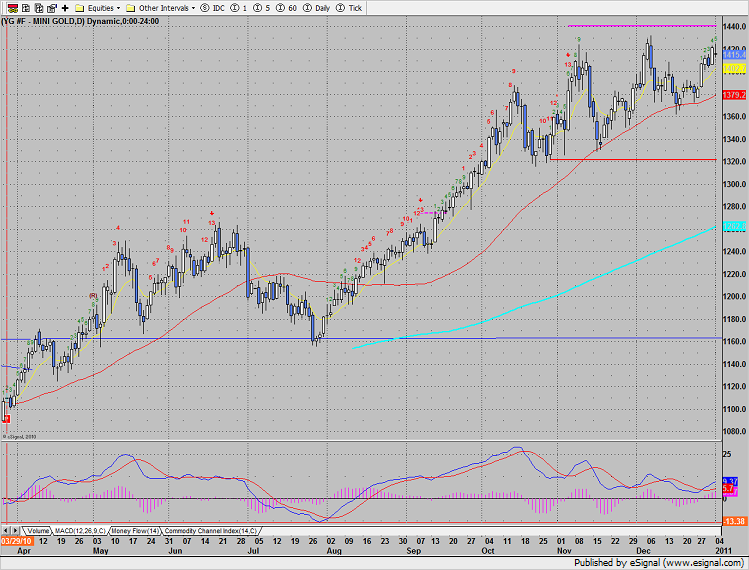
Gold was lower on the day:
Market Preview for 1/4/11
January 3, 2011
|In Tradesight