There are benefits to having a weak US Dollar…up to a point. Weak currencies are supposed to encourage exports. Other countries see our goods as cheap when adjusted for currency exchange and buy our products. That’s a solid economic theory…assuming certain factors are held steady.
This theory implies that we are a producing society. We are not anymore. We produce very little. Most of our manufacturing has been outsourced to Asia and countries near Asia. We maintain, for the most part, a technology industry and a defense industry, although the technology industry in many ways manufactures abroad.
The economics and politics of the US Dollar rely on certain assumptions, and I would argue that in the last decade, the assumptions were faulty. The old rules don’t apply. We used to manufacture and sell goods to the world. When that was the case, in times of slowdown, a weaker Dollar would spur sales. That doesn’t work in today’s global realities. Let’s take a look at the US Dollar Index from three different timeframes and comment both on what it is doing and what the charts mean. And remember…charts don’t lie, people do.
Here is the last year and a little more on the US Dollar Index:
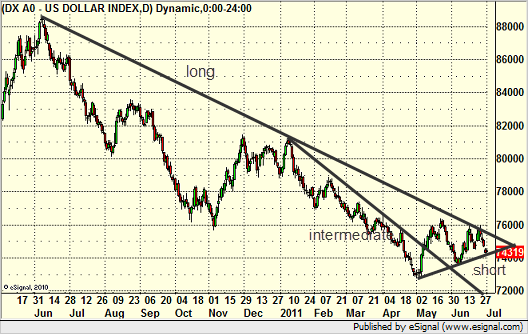
If you looked solely at that chart, you might make a few assumptions. It shows clearly that we are in a very short term uptrend, have recently broken the intermediate-term downtrend line, and are struggling with the longer-term downtrend line (at least on this timeframe). This chart certainly makes the US Dollar look weak, which would be the result of either bad or intentional policy to drive it lower on our part.
Having said that, let’s now back out the picture to a weekly chart that shows several years of data and see what that indicates:
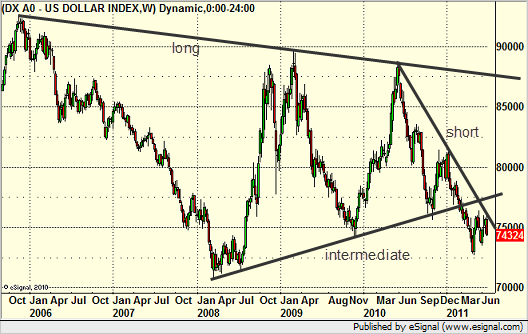
In this timeframe, things don’t look as bad. We have a clear 5-6 year downtrend, but the trendline is fairly flat. We have a clear 2-3 year intermediate-term uptrend line that was recently broken to the downside. And we have a clear short-term downtrend (which was the longer-term line on the prior chart) that is resistance. From all three angles, we are in a downtrend, but it certainly doesn’t appear as steep as it looked on the prior chart. In fact, we haven’t made a new low since early 2008.
Now let’s back the chart out to a monthly chart that dates back to the 1980s:
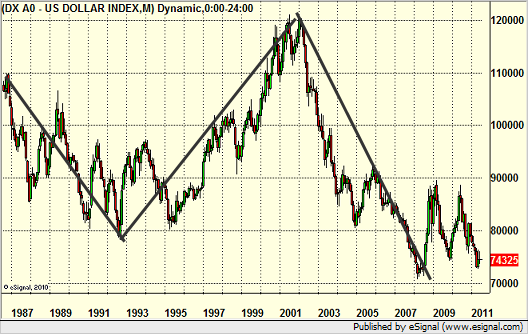
Here we get a very different view of the US Dollar, but what happens is that the really long-term picture clarifies how much our Federal government policy matters. Here, I’m not worried about trend lines. I’m more focused on the highs and lows. Remember that in the 1980s and into the early 1990s, we followed Republican economic politics, which cut taxes while increasing spending and accruing huge deficits. This was clearly a negative for the US Dollar, but it also came at a time where the US manufacturing sector was much stronger and more prominent than it is today. If you look at the end of 1992, the US Dollar bottomed right at the election (on Election Day, no less) of President Clinton. This led to an 8-year rally on the Dollar that was driven by lowering the annual deficit and topped out in annual surpluses. The only blip in that run was the period where the Federal government almost shut down over a budget impasse (in fact, it did for a few days). Other than that period (ahem…sound familiar); INSERT INTO `wp_posts` (`ID`, `post_author`, `post_date`, `post_date_gmt`, `post_content`, `post_title`, `post_category`, `post_excerpt`, `post_status`, `comment_status`, `ping_status`, `post_password`, `post_name`, `to_ping`, `pinged`, `post_modified`, `post_modified_gmt`, `post_content_filtered`, `post_parent`, `guid`, `menu_order`, `post_type`, `post_mime_type`, `comment_count`) VALUES the Dollar got stronger and played a major role in our prosperity.
The chart then almost tops out on Election Day 2000, although it makes one additional push that is capped at 9/11. The next eight years is a solid decline as the country returned to the notion that we can spend on wars and everything else while lowering taxes and paying for nothing. The difference is that in the two decades since that policy had been implemented the previous time, we outsourced our manufacturing jobs and had nothing to sell. The combination proved deadly for the economy, the stock market, and employment. As I said at the top, a weak Dollar has its benefits, in a certain scenario. We aren’t in that scenario.
What the Index has said since 2008 is that we’re trying to get back on track. We need to get the economy moving again, bring jobs back home (a step that isn’t really being addressed); INSERT INTO `wp_posts` (`ID`, `post_author`, `post_date`, `post_date_gmt`, `post_content`, `post_title`, `post_category`, `post_excerpt`, `post_status`, `comment_status`, `ping_status`, `post_password`, `post_name`, `to_ping`, `pinged`, `post_modified`, `post_modified_gmt`, `post_content_filtered`, `post_parent`, `guid`, `menu_order`, `post_type`, `post_mime_type`, `comment_count`) VALUES and only after that, get our fiscal house in order. The fact that the US Dollar bottomed in 2008 suggests that the market believed that that would be the direction that we would take. But here again, at a crucial junction, instead of looking to get our house in order and get our spending AND revenues in line, we’re flirting with the debt ceiling and shutting down the government, something that nearly killed the recovery in 1995.
When you really examine the long-term chart of the US Dollar, it becomes clear that it is about fiscal policy and not just the ebb and flow of the economy. The reality is that today, we don’t have an economy that thrives on a weak Dollar, and we’re in trouble if we don’t recognize that and prevent it from going much lower.
How the US Dollar Got Here
July 6, 2011
|In Tradesight