MOB (Make or Break) Projection for GBPUSD Breakout
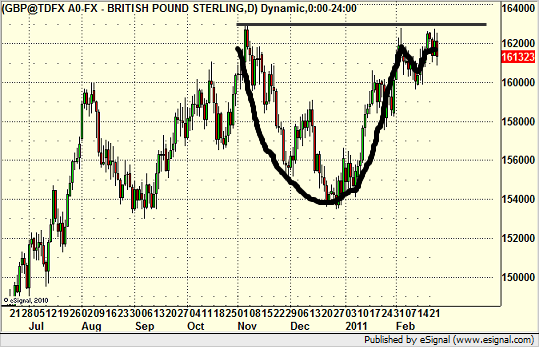
There is a lot of focus right now on the fact that the US Dollar Index looks extremely weak and is breaking some key technical indicator levels that threaten a potentially big downside move. One part of that equation is that weakness in the US Dollar would likely lead to a breakout of the cup and handle formation over 1.6299 on the GBPUSD, which is a multi-month and clean cup and handle formation, as seen here:
If we look at the chart with our 9-bar Seeker energy counting mechanism, we see a few key points. First, the beginning of the cup formation starts back at point A, which was a 9-bar move to the upside that topped the GBPUSD:
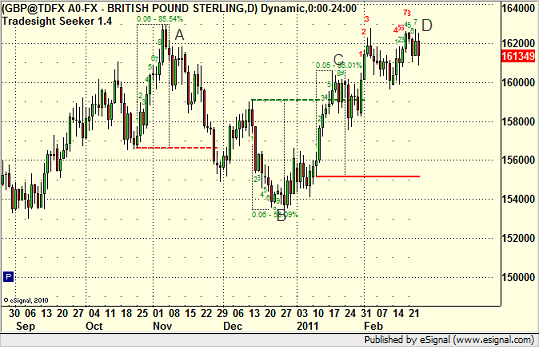
Second, on that same chart, the low is formed at B at the end of a 9-bar move down from the Seeker calculation. Third, the pair paused at C, another 9-bar top. So we have to say that the GBPUSD daily chart is very in tune with the 9-bar counting mechanism. What does that mean for now, where a cup and handle is set up at the end of that chart above at D, but we are 7 bars up on the daily? Is the breakout looming or should we pause after we get a 9 bar top signal?
Our analysis suggests that we could easily pause here ahead of that breakout and still meet the objectives of the breakout. If we draw a MOB (Make or Break) line in Elliott Wave theory from the last top, we get this line:
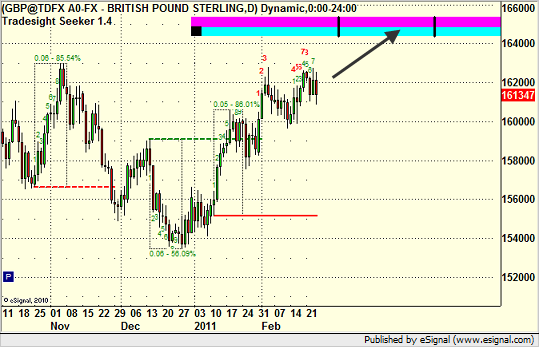
The most likely point of hitting the line is between the black vertical points, which means that we are still early. That means that we could get a 9-bar count, then pause for a bit to absorb that energy, and still breakout and hit that MOB line in the right place. Just something to focus on.
Take a trial of our services in your asset class here. Have a look at our Video Lesson of the Day on the home page here. Follow us on Twitter here.
GBPUSD Breakout Projection Using MOB
February 24, 2011
|In Tradesight