A couple of months ago, we were watching the rising triangle wedge that was forming between the two lines on the chart below, looking for a breakout or breakdown. At point A, the Index broke out intraday but failed to close above the key 76.00 level. It ended up breaking under the trendline at B, but that ended up leading to general sideways action for August doldrums:
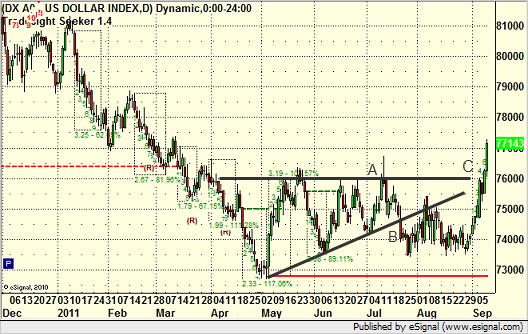
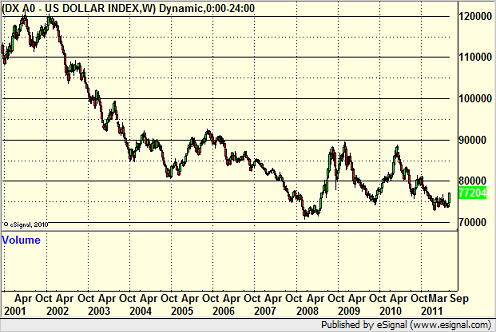
We have now officially rallied at C and broken through the 76.00 level, which is significant and bodes well for the US Dollar over the next weeks and perhaps even months. It also means that the US Dollar Index low still was back in 2008 for now, as you can see on this weekly chart:
A Key Breakout on the US Dollar Index
September 9, 2011
|In Tradesight