As we approach yet another Fed announcement where no change in rates is expected, we wanted to do our usual analysis of the US Dollar Index to see if there is anything critical from a technical perspective that we should be aware of heading into the news.
So let’s have a look at the US Dollar index daily chart with a regression channel off the lows and the exhaustion 9-bar counts:
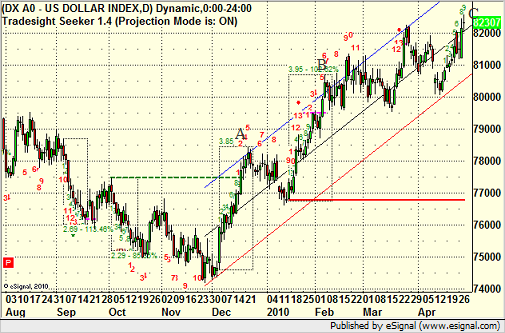
One key feature of the 9-bar exhaustions is that when they line up against key support and resistance, they are high-probability turning points in the market. Today’s bar, once it completes, will be the ninth bar of the move. Now, remember that even past the ninth bar, the setup phase of the exhaustion doesn’t have to terminate until we get the dashed box drawn around the area. For example, if you look at point A that I have designated on the chart, you’ll see that the box ended right there, which was several bars past the 9-bar count. This was also against the upper regression line and thus led to a downward turn for a month in the US Dollar Index. You can then see the 9-bar move up that followed, where the box is drawn and terminates at B, also just outside and above the upper regression line. That one led to a pause but not much of a pullback in the market as the energy exhausted.
In both cases, the ninth bar itself occurred close to the upper regression line, and then the setup box completed a few days later at or even above the line. For purposes of this general analysis, we’ll ignore the 13 bar buy and sell signals on the chart as the energy setup moves themselves can be useful.
Now, let’s consider where the chart is today at point C. This is the ninth bar of the count, but we are in the middle of the regression channel. Therefore, while the market may have expended upward energy to get here, we aren’t yet near the major resistance that has been the upper regression line. There are a couple of ways that this can play out, and the key will be to see where the box draws that represents the end of the setup move.
If this extends to the upside for a couple of days and we get the signal near the upper regression line, then it will represent another short-term exhaustion against resistance and a short-term sell signal. However, if the box completes sooner, it would indicate that the momentum of this move is less than prior moves. This would give us an earlier sell signal before the upper regression line, BUT, it increases the chances of a more major turn in the market that might break the lower regression line moving forward.
The fact that we have gotten at least the 9 bar completion heading into the Fed meeting day is always interesting. It means a signal is coming soon, and the Fed announcement may be what drives it.
The US Dollar Index pre-Fed Announcement
April 28, 2010
|In Tradesight