One of the things that we like to focus on is something called Market Direction. We utilize a tool in Forex, Stocks, and Futures that measures three levels of market direction for the day, starting with the open of the market. In Forex, the open is considered 5 pm EST, or global rollover. From that point forward, we compare where the market is compared to the opening price, the midpoint of the session so far, and a 10 EMA. We end up with three lines. If we are above two, we consider market direction to be green. If we are below two, we consider market direction to be red.
Today, we had a short entry on the GBPUSD under a key Gann level at 1.5425. This triggered heading into the European session (charts here are in Pacific Standard Time) at point A. We covered half of the trade approaching S1 at B and kept the second half on, looking to adjust our stop for later:
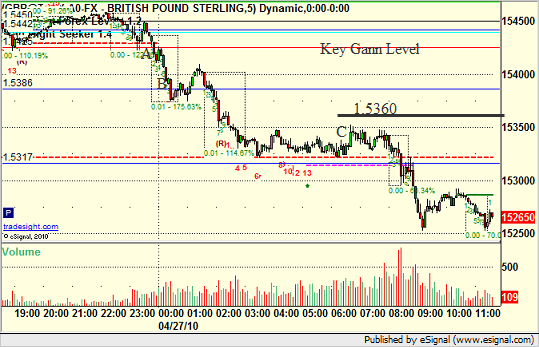
By then monitoring the US Dollar Index with our market directional tool as described above, we can see the point in the trade where we would want to exit the final piece of the GBPUSD. Here’s the US Dollar Index on a 5-minute:
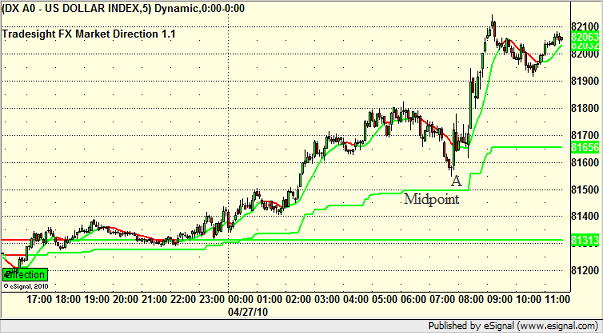
Note how it was approaching the midpoint around 7:30 am PST at A. A move under that line would flip market direction to red, thus signaling us to exit the GBPUSD trade and lock in the gain. That would have occurred around the 1.5360 on the GBPUSD chart above, which I’ve drawn with a black line.
The midpoint on the US Dollar did not break, and thus we did not stop out of the trade. This kept us in the trade for the next spike, which was a news spike based on debt downgrades. Very important to use logical stops in your trading and not just exit because you feel like things might be reversing. Take a top down approach and let the market be your guide.
You can follow us on Twitter for more details by clicking here, or take a free trial to our daily FOREX trade calling and education service here.
Some Basic Pointers on Stops for GBPUSD
April 27, 2010
|In Tradesight